Contractors should be collecting data on every site, writes Paul Gandy. You can use that information to run your project, and your business, better.

Too often, construction projects are managed by gut instinct. Progress reports are full of opinion – they provide snapshots but don’t show trends and can’t accurately forecast where the project will be in a few months’ time.
But if we’re serious about delivering projects on time, within budget and to the right quality, then we must put data at the heart of our project management.
Here’s an analogy I often use: imagine a pilot who refuses to check the fuel gauge, believing he has enough fuel to finish the flight. When the engines cut out, it’s too late to fix the problem. Construction projects run the same risk when we ignore what the data is telling us.
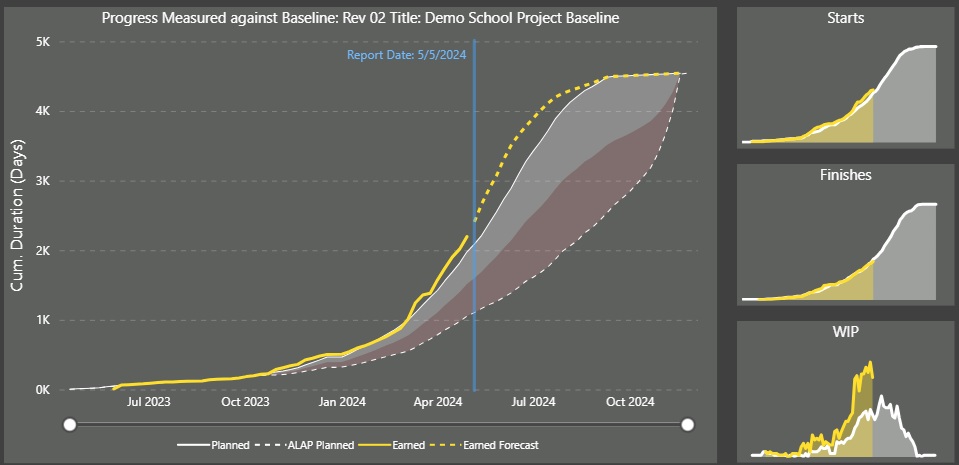
These days, contractors are – or should be – collecting data with every project. The tools exist to mine and utilise this data. Production rates, health and safety stats, quality indicators, even workforce activity – this data can all be captured and monitored using graphs and dashboards.
They show direction of travel, not just current position. They help teams respond before a small issue becomes a big problem.
Measuring what matters on site
Let’s take a simple example: cladding a building. Every programme shows when an elevation is due to start and finish. But unless you know the expected output – 20 panels a day, say – and measure what’s actually achieved, you won’t know if you’re behind programme till it’s probably too late. Output rates should be linked to the original logic of the programme. A simple graph can show immediately whether you’re on track or not.
The same applies to overall productivity. You should know what your spend per worker per month should be, and whether you’re hitting it.
Whatever your market, learn your productivity. With those benchmarks, you can instantly assess whether your current workforce can realistically deliver the remaining project scope within the required timeline.
Making it business as usual
Bovis introduced this data-led approach in 2007. I’ve seen it at other big contractors, mainly for major schemes. At Tilbury Douglas, we have rolled out this system across a range of projects – schools, hospitals. I suspect many contractors are doing versions of this, but few have made it business as usual across the entire organisation.

Most large sites now use digital access control, so the data is already there. Armed with that sort of information, you can start getting much deeper into productivity. You can measure what output you were getting from your subcontractors. You’ll know what the earned value was.
This approach is welcomed by project teams that use it. Over the last 20 years, I’ve never seen a site team reject it once they’ve experienced the benefits. It boosts confidence. It makes reporting easier and clearer. It empowers better decisions – whether that’s a supervisor talking to cladders about slow output on Monday morning, or the managing director looking at all live projects.

Using historic project data, AI tools can identify performance trends, predict likely outcomes and flag early warning signs
There are longer-term business benefits. With consistent data across multiple projects, contractors can build a historic dataset which informs future programmes and tenders.
You’ll know what productivity rates are achievable in specific trades, regions or build types. That leads to more accurate planning, pricing and risk management.
Introducing AI
And the next step is to bring in AI. With enough historic project data, AI tools can identify performance trends, predict likely outcomes and flag early warning signs.
Ultimately, this is all about managing risk and opportunity. That’s what project management is. If you understand the risks, spot the opportunities and monitor progress – using your data – then you can manage projects more effectively.
You don’t need major business changes to adopt this data-led approach to project management. Software like Power BI can extract and visualise data from almost any system: quality, safety, finance, programming. You just need someone who knows how to use the tools.
But this isn’t really about software. It’s about understanding what’s happening on your site, then using that knowledge to run your project – and your business – better.
Paul Gandy is president of CIOB and a board adviser at Tilbury Douglas, where he was previously CEO.


